Server & Bot Analytics
Discover, Manage, and Scale Discord Bots
Launch Analytics ConsoleUnified Dashboard for Bot Fleet Health
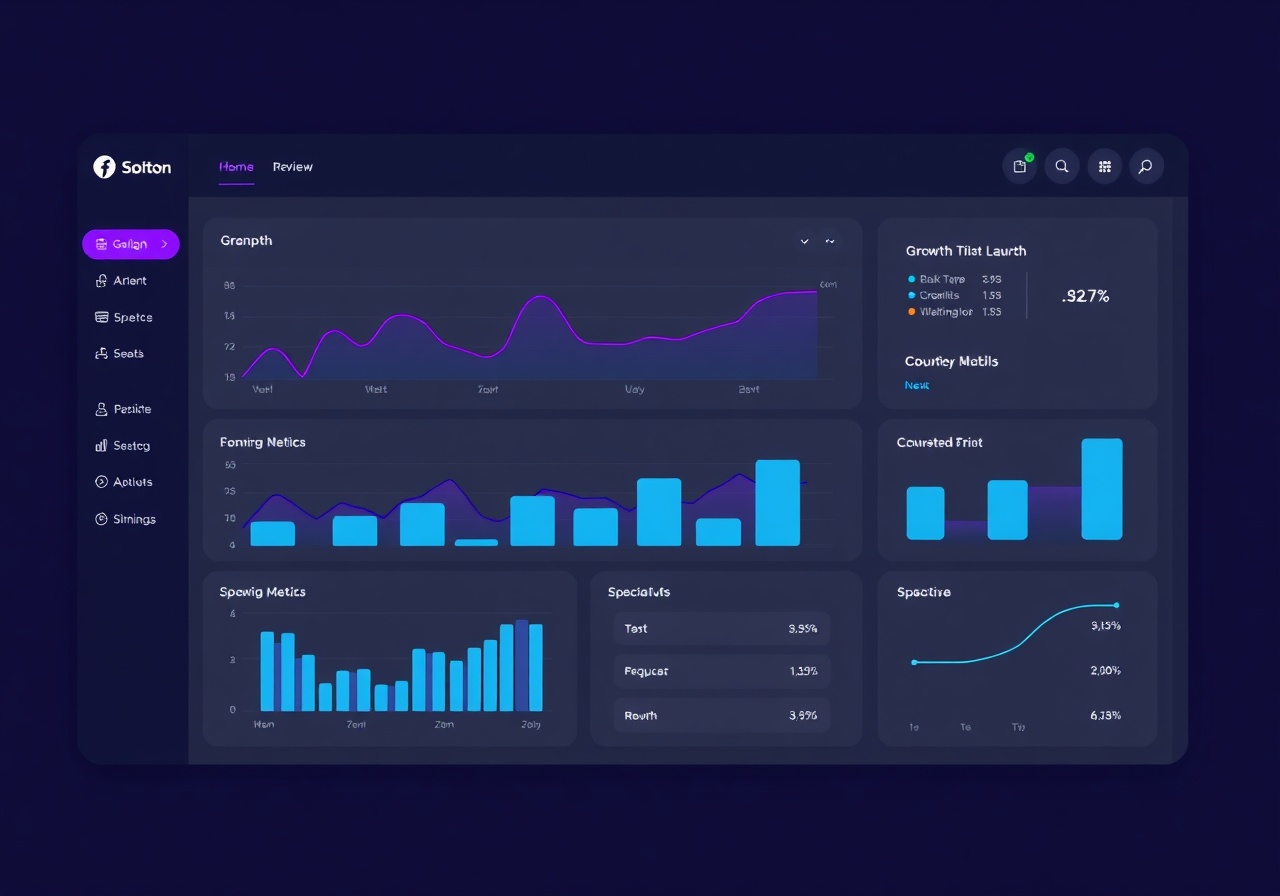
BotNexus consolidates telemetry from your entire bot infrastructure into a single, actionable interface. Track command latency, shard stability, and resource consumption across 1,200+ guilds. Instantly spot anomalies, such as a memory leak in the `AudioStreamer` module or a spike in `PermissionDenied` errors on the `!mod` command suite.
Granular Metrics for Optimization
Make data-driven decisions with over 40 tracked data points per bot instance. Export CSV reports for stakeholder reviews or configure webhook alerts to trigger when critical thresholds are breached.
API Rate Limit Utilization
Current usage is at 87% (13,050 / 15,000 requests). BotNexus predicts a global rate limit saturation in 42 minutes based on the current `!avatar` burst pattern. Auto-throttling is active to prevent 429 errors.
Shard Heartbeat Latency
Average heartbeat across 8 shards is 124ms. Shard 3 reports 310ms latency due to regional gateway congestion in `us-east-1`. Automatic reconnection is queued to restore optimal routing.
Command Success Rate
Overall success rate stands at 98.4% over the last 24 hours. The `!ticket create` command shows a 4.2% failure rate attributed to role permission mismatches in 12 newly onboarded guilds.
Active Guild Growth
Net gain of 340 guilds this week. Churn rate has dropped to 1.2% following the v4.5.0 stability patch. Peak invitation velocity occurred on Tuesday between 18:00 and 20:00 UTC.